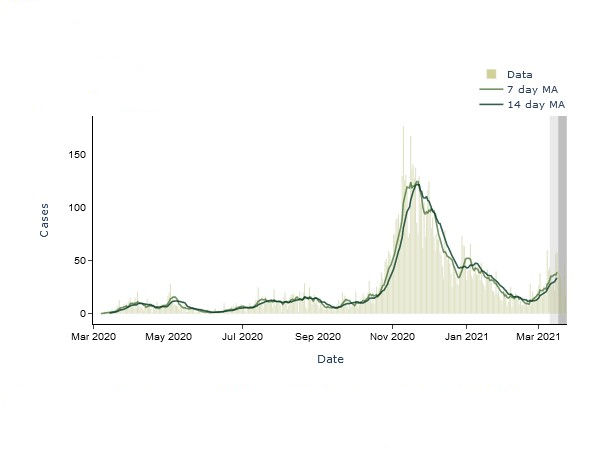
I made my COVID-19 dashboard for southeast Michigan in Python and used the libraries Beautiful Soup to obtain data from the web, pandas for data aggregation and cleaning, and the duo of Dash and Plotly for the web app and data visualizations. This post is a quick overview of the technologies I used to create and host it.


